Newcastle MathsJam April 2012 Recap

April’s MathsJam was very enjoyable. We did a bit of arts and crafts, a bit of playing games, and if it had been NBA Jam instead of Maths Jam I would have been entirely on fire because I used up all my IQ points solving some very fun puzzles. Durham were still on their Easter holidays so the attendance was a modest six people. That was just enough for everyone to be doing the same thing at the same time, so we had a good time.

Read more…

Newcastle MathsJam March 2012 Recap

It’s been two months since I last wrote one of these! March was a haze of overwork and stress for me, so I didn’t write a recap for March’s MathsJam while it was still March. Peter Rowlett, who was visiting Newcastle as part of his mission to avoid having to think up new puzzles for MathsJams by always attending different ones (and also to give a talk at the university) has kindly sent me his notes, so here’s what I’ve reconstructed:

Read more…

A little applet to make maths for screengrabbing

Paul Taylor wanted an easy way to write some maths he could take a screengrab of, for use as an icon. Before I intervened he was doing something unnatural with wikipedia, so I wrote a little applet using MathJax: “make big maths“.

Quite a few tools like this exist, using mimetex or some other CGI tool to run LaTeX on a server and produce an image file. That’s far too slow and rubbish-looking for my liking, so I made my own with MathJax.

Interesting Esoterica Summation, volume 3

Summing up some more interesting esoterica seems like the right thing to do at the moment, so here’s that.

A reminder: every now and then I encounter a paper or a book or an article that grabs my interest but isn’t directly useful for anything. It might be about some niche sub-sub-subtopic I’ve never heard of, or it might talk about something old from a new angle, or it might just have a funny title. I put these things in my Interesting Esoterica collection on Mendeley.

In this post the titles are links to the original sources, and I try to add some interpretation or explanation of why I think each thing is interesting below the abstract.

Some things might not be freely available, or even available for a reasonable price. Sorry.

Read more…

Slides about the princess in a castle puzzle

I gave a talk to our internal postgrad forum last week about the princess in a castle puzzle. I made some slides for it using deck.js. They looked quite nice and I could just about get what I wanted in them, but I now know that using SVG in HTML is still an enormous faff if you want it to scale nicely, which is basically the only reason you would use SVG.

Click here to see the slides.

I’m not sure if you can follow along with the slides without me talking; maybe I’ll do a transcript with slide drive later.

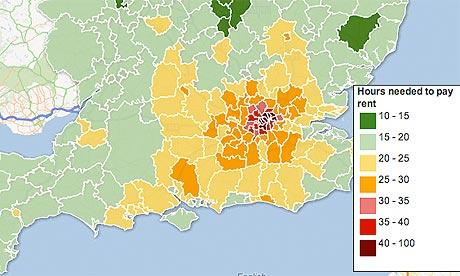
Visualising the wrong data on the Guardian data blog

This visualisation shows for each council or unitary authority how many hours a week you’d need to work, earning minimum wage, in order to pay the median rent for a one-bed flat. The minimum wage is a national constant.

No justification is given for using the median rent. In a fair world, the median rent should be paid by someone on the median income. Assuming that people earning the minimum wage are the lowest earners ((this isn’t true: people earning cash in hand, for example, might earn less than the minimum wage but they still have an effect on house prices)) and make up X% of the population, then an upper bound for rent paid by people earning minimum wage should be the Xth percentile, if housing is provided fairly ((another large assumption.)). If you’re not paying attention to this kind of thing, you might as well just say “average” instead of “median”.

Finally, there’s this:

Note that these figures are dramatic simplifications, used for illustrative purposes only: in reality tax payments, tax credits, housing benefit, council tax, utility bills and more substantially alter these figures.

So the figures are meaningless anyway – benefits might be so generous that very little of the lowest earners’ pay goes towards housing, or taxes might be so high that people really need to work many more hours than this statistic claims in order to keep a house.

Supposing that all of these problems are sorted out and we calculate a reasonable-sounding number of hours to work to earn rent each week, what should that number be? What if house prices plummeted but food became very expensive? I can’t think what these numbers are telling us that raw rent data aren’t already.

A question has occurred to me: would I be making life worse for those worse off me by living in a flat cheaper than I should be or, on the other hand, would spending a higher than average proportion of my income on rent drive prices up, having an effect on the bottom end of the market? I suppose taking a cheaper flat reduces the prices of nicer ones. This is why I don’t like economics.

Gatterdam’s proof that free products with amalgamation are En+1-computable

I haven’t posted any research in ages! I haven’t done any research in ages! Here’s a rewriting of a theorem from Ronald Gatterdam’s doctoral thesis, in more sensible language. I’ve proved the same theorem for fundamental groups of graphs of groups.

The main problem with Gatterdam’s proof was that he didn’t invent any new notation to make life simpler, so he wrote out pages and pages of very repetitive function applications.

I’ve made up a lot of notation to make dealing with functions in the Grzegorczyk hierarchy a lot easier, so you’ll probably need to refer to my draft paper for a few things. I keep all my research notes in a repository on github, by the way.

Read more…

Using a zero-knowledge protocol to prove you can solve a sudoku

I’ve just uploaded to youtube a video I made with Katie Steckles to demonstrate why zero-knowledge protocols exist and how one works.

Katie is a habitual liar, so we followed the zero-knowledge protocol described in the paper, “Cryptographic and Physical Zero-Knowledge Proof Systems for Solutions of Sudoku Puzzles” which you can download from http://www.mit.edu/~rothblum/papers/sudoku.pdf

By following this protocol, Katie can prove that she isn’t lying to me about being able to solve the puzzle, without revealing anything about how she solved it.

The paper I mentioned, “How to explain zero-knowledge protocols to your children” is an excellent explanation of the ideas behind zero-knowledge proof. You can get it from http://pages.cs.wisc.edu/~mkowalcz/628.pdf

Fractal dimension in IKEA

A long time ago, I realised that IKEA’s shopfitters must be experts in fractal dimension – they manage to lay out their shop so that you have to walk past every single thing they’re selling. You can’t just nip into IKEA – you have to go through the whole hour-long “It’s A Small World” of affordably wobbly furniture even if all you want is some kitchen utensils from the bit at the end.

I’d been meaning to add something about this to the Maths in the City site but it required going in to IKEA and taking a picture of their floor plan for illustration. I just remembered this morning that I’ve already taken one of those pictures, so I spent half an hour writing up this article – Fractal Dimension in IKEA.